Visualization Sessions.

You talk, I draw, they see things clearer.

AI is a good tool for extracting perspectives one at a time. Interview each person, aggregate the notes, produce a summary. Real value.

What AI can’t easily do is get 20 people in a room to watch themselves being represented together, negotiate what’s actually true in public, and leave with a shared picture. That’s a social event with a human catalyst at the center.

Leadership values the second scenario because they need the room to agree, not just the data to exist. A team that got aligned in a live session commits to the outcome differently than a team that got a summary of everyone’s individual input.

My work runs at the front end, before AI gets prompted. I sharpen the question. Then AI goes to work with something worth working on.

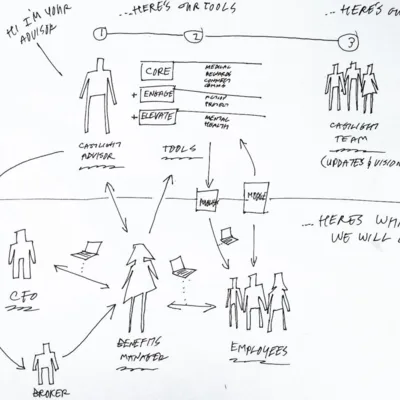
Strategy diagram sketch with marker
Visualization work
Visualization work
Visualization work
Visualization work
Visualization work
Visualization work
Visualization work
Visualization work
Visualization work
Visualization work
Visualization work
Visualization work
Visualization work
Visualization work
Visualization work
Visualization work
Visualization work
Visualization work
Visualization work
What actually happens in a session

Listen, draw, align.

01 · Listen

Radar, on.

I’m there to listen, absorb and formulate insights, patterns, and possibilities. Listening first, then questions, rapid back-and-forths, and then insights and ideas arise. I might already know your brand and market quite well. Or I might be totally green and that’s often the best place to be in situations like this. Fresh perspective often sees what the room’s been blindly staring at.

02 · Draw

Real-time visualization on the whiteboard.

I draw what I hear. Sometimes I draw it wrong. Your team corrects me. That's the fastest path to right. Everyone in the room watches the picture form, sees themselves represented, and negotiates in public what's actually true. Nobody leaves wondering what got captured or what comes next.

03 · Align

Shared picture, shared starting point.

By the end of the session, twenty people who walked in with twenty different mental pictures leave with one real visual. Now you can go make decisions. Now AI can go to work on the sharpened question. Now the strategy conversation actually has a foundation.

Session highlights

It’s amazing what a marker can do!

Osprey
Osprey

Helping a founder envision their desired future.

Founder-CEO Mike Pfotenhauer, of the number-one backpack company in the industry, was looking for relief and a vision. After years of building an industry-leading brand, he was ready to map out a path to a way of working that was back to his core truths. A two-day, one-on-one conversation and visualization session unfolded. Over seventy pages of 11x17 doodles, maps, patterns, and ideas were captured. Packaged into a visual story that captured what he’d been feeling but hadn’t seen laid out in one place. It became his recentering tool for the business transformation actions that lay ahead.

SYPartners
SYPartners

A social giant in need of a tech ecosystem and product launch map.

I was brought into SYPartners to help visually map the tech ecosystem and marketing journey that their new product platform was prone to face. The complexities of community, technology, timelines, buy-ins, roadblocks and hundreds of other factors were discussed and visually charted onto a behemoth of a board. Complex, indeed. Revealing, clarifying and action-inspiring, absolutely.

Butler, Shine & Stern

20 people from HR, one big administration mess.

Full HR team. Processes, bugs, dead ends, goals, conflicts. I drew a series of whiteboard maps in real time during a day-long session. They talked, I captured, they corrected, I re-drew. By end of day they had a picture of themselves as a system, with the overlaps and conflicts visible. Now they had somewhere to start.

Marin Bikes
Marin Bikes

Whiteboard vs. a skeptical head of international sales.

The new head of international sales had just joined Marin from the market-leading brand at the time. A bit salty about our creative team’s limited resources and bandwidth, he asked me in a meeting, “And, what is it that you do, Tom?” A five-minute run-on sentence response would not clarify the complexity. I grabbed a marker and covered the eight-foot whiteboard with the entire design workflow for producing and marketing 200 bike models a year. Concept to paint jobs, international factory communications to photo shoots, catalogs, ads and P.O.S., stacked as one system. The marker is mightier than the mouth. The sales team suddenly could see what we were really achieving with so little.

Accenture Song
Accenture Song

Five years of visualization at Fortune 50 stakes, done daily.

Live doodles on client Zoom calls. Deck simplification that turned 150-page consultant walls of text into 20 concise slides with refined vector diagrams. Every account, every industry and every day, my quick pen skills were called upon to rapidly visualize what couldn’t be seen through the overloaded haze.

OSMO Nutrition
OSMO Nutrition

Visualizing the sports-science of hydration and recovery.

A new supplement start-up, OSMO was ahead of the curve on how most athletes and brands thought about hydration and recovery. Too much science, too little time, they needed an engaging and fun way to introduce their line of products. This time, I brought the drawings to life in a series of videos. Take a peek →

Want to see what I’m talking about? Flip through this overview and sample deck →

Book a session.

If your team is stuck on the shape of the question, or aligned on the answer but not the path, I’m here for it. Half-day, full-day, and multi-day formats. Remote or in person. Boardrooms, off-sites, brand sprints, product decisions, org problems. I love drawing and problem solving, in realtime.

Get in touch